Viewer
The analysis tools are located in analysis/:
analysis/
├── view_trajs.py           # Trajectory viewer (Gradio web interface)
├── visualize_results.py    # Training/test metrics visualizer (matplotlib)
└── font_manager.py         # Font downloading and caching for Unicode support
Trajectory Viewer
A Gradio-based web interface for inspecting agent trajectories step-by-step.
python analysis/view_trajs.py <split> [OPTIONS]
Arguments:
split(required):trainortest--data-path <path>(required): Data directory path--log-path <path>(required): Logs directory path--show-prompt: Display full prompt and response for each step--position <first|last>: Load first or last N iterations (with--num-iterations)--num-iterations <N>: Number of iterations to load
Examples:
python analysis/view_trajs.py train --data-path /home/v-baihao/data --log-path /home/v-baihao/logs
python analysis/view_trajs.py train --data-path /home/v-baihao/data --log-path /home/v-baihao/logs --position last --num-iterations 5 --show-prompt
Features:
Interactive step navigation with screenshot display
Action coordinate visualization (red dots on screenshots)
Task metadata display (difficulty, domain, subdomain, website)
Reward and evaluation info per trajectory
Accessibility tree inspection
Submission judgment display
Interface Panels:
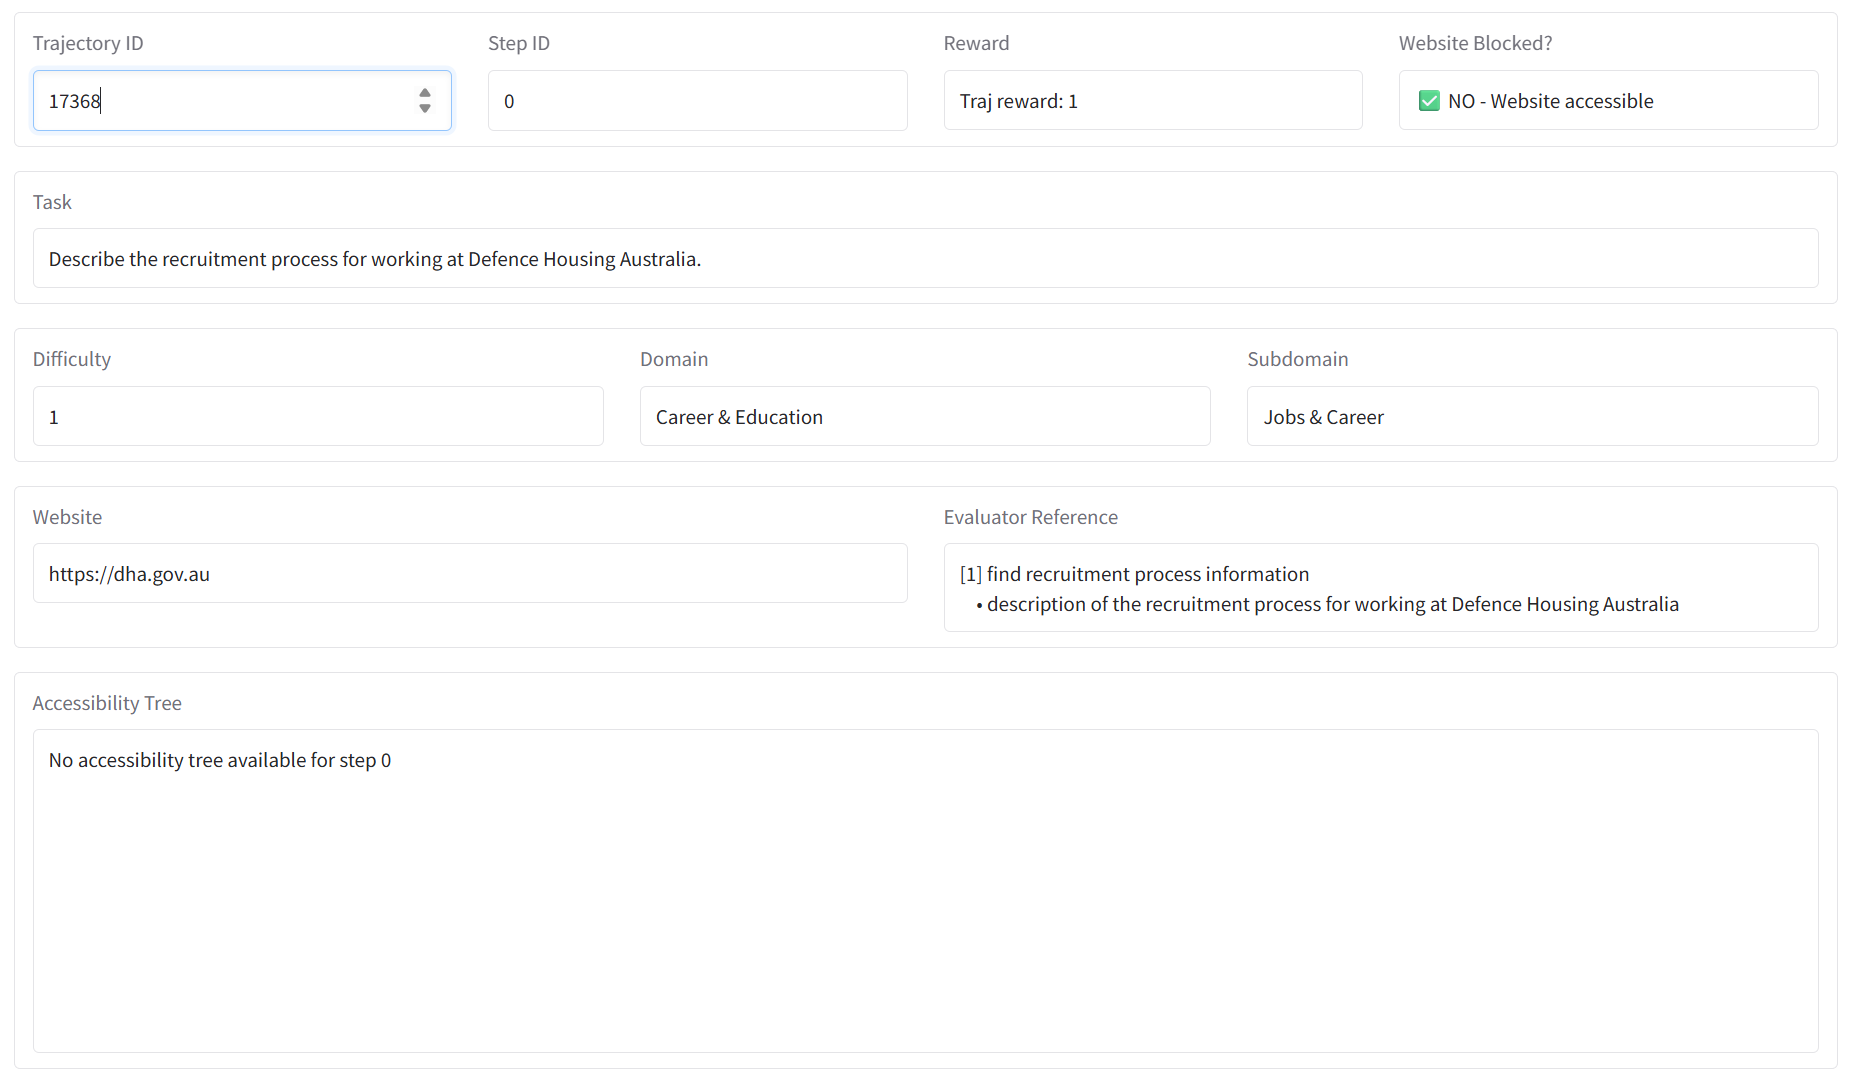
The metadata panel shows trajectory ID, task description, difficulty, domain, website, evaluator reference, and accessibility tree.
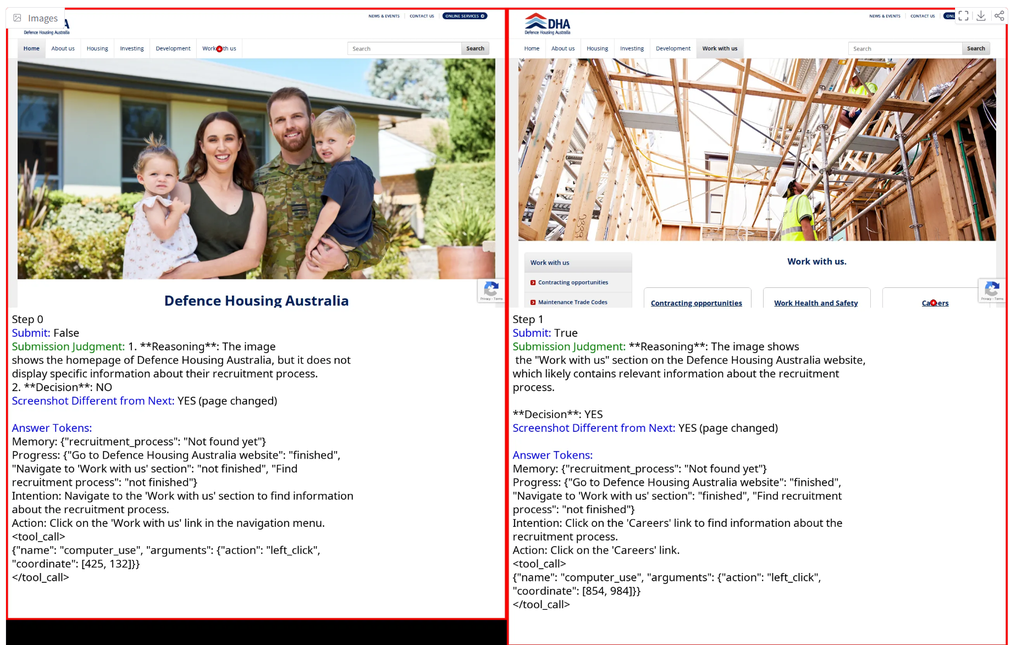
Side-by-side screenshots of consecutive steps with action coordinates, submission status, and submission judgments.
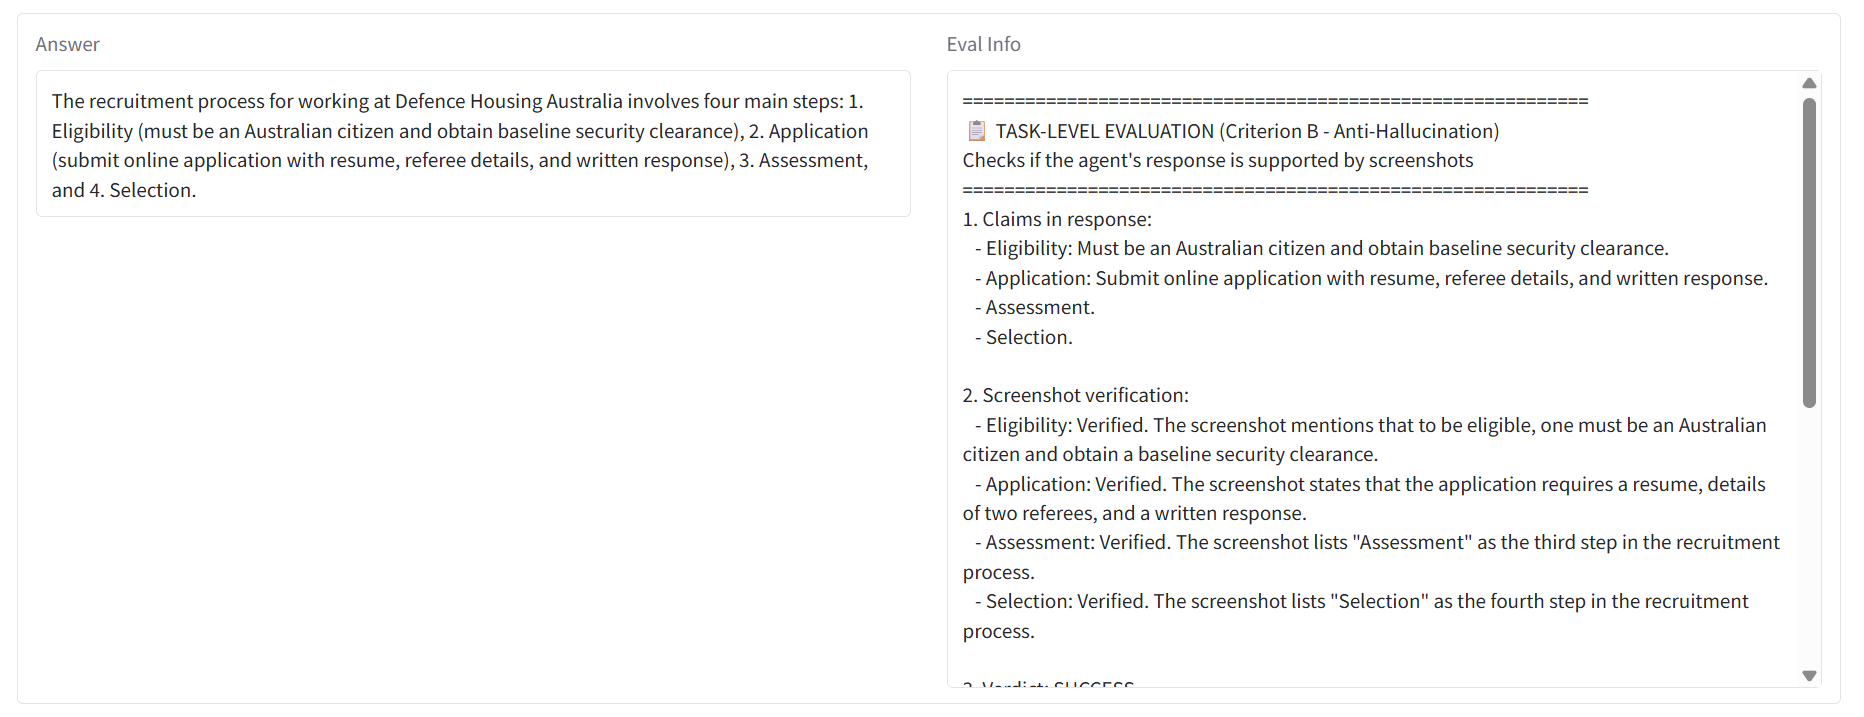
Agent’s final answer with claim-by-claim Criterion B verification against screenshots.
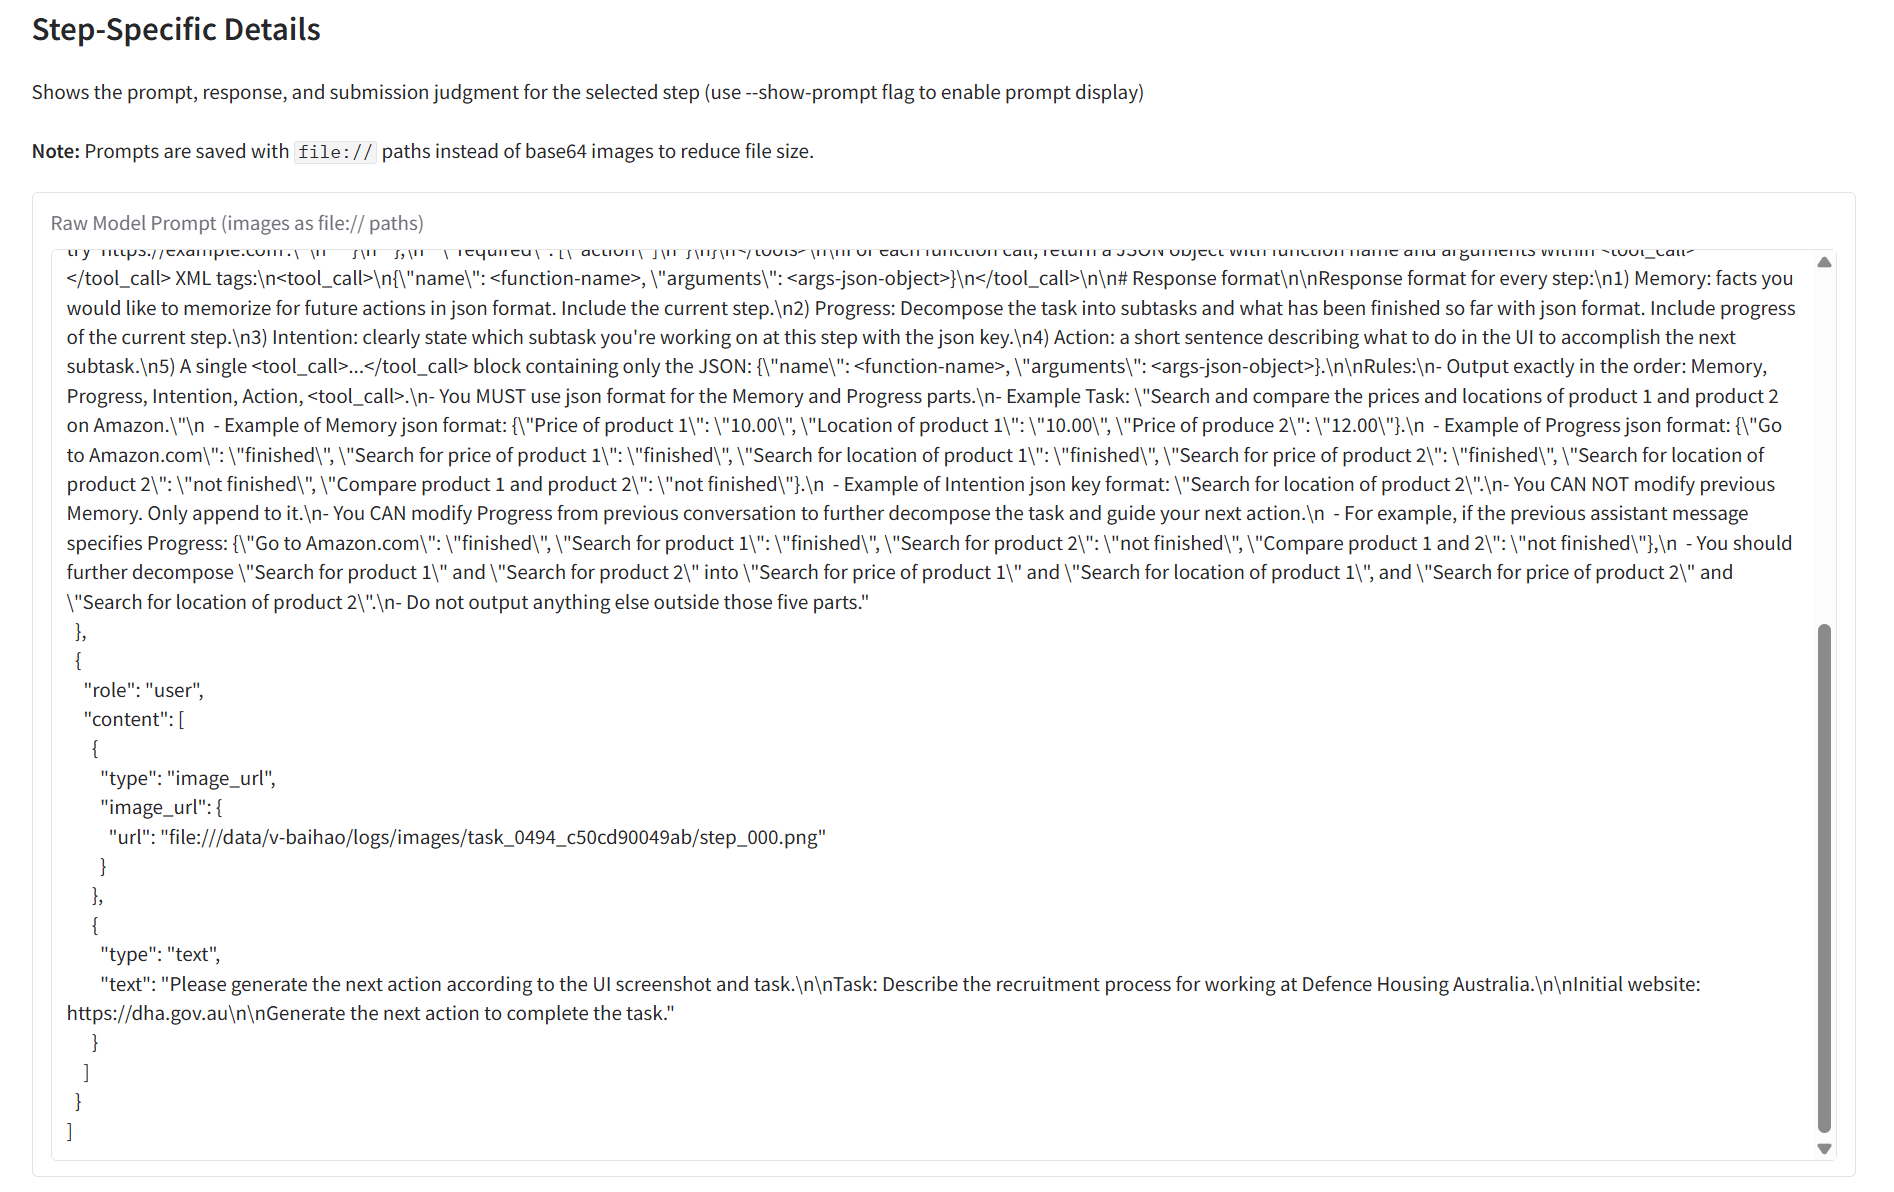
Full model prompt in JSON format (system message, image inputs, task instructions).
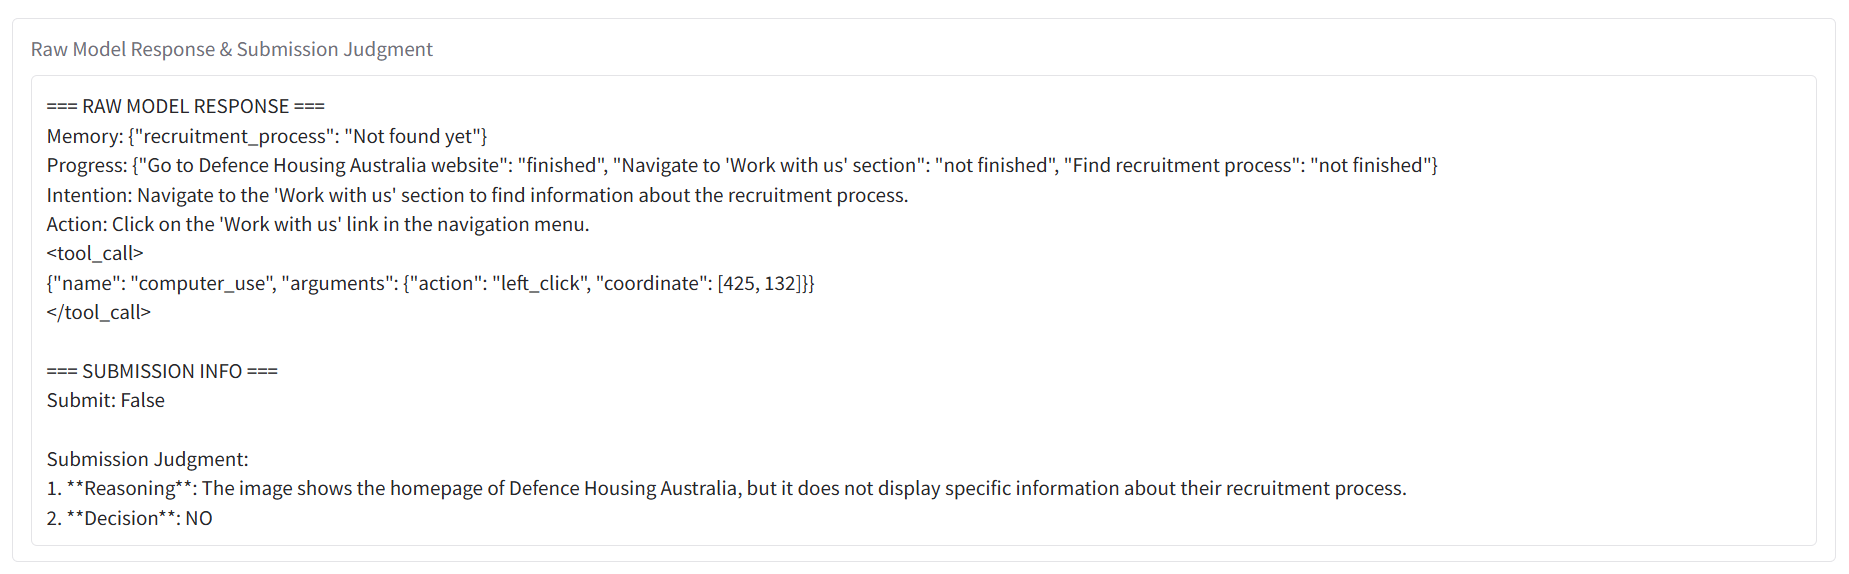
Model output showing memory state, progress tracker, intention, action, and submission judgment.
Visualizer
Generates matplotlib plots for training progress and test performance.
python analysis/visualize_results.py [OPTIONS]
Options:
--data-path <path>(required): Data directory path--log-path <path>(required): Logs directory path--mode <mode>:train-only,test-only, ortrain-test(default:train-test)--ema <float>: EMA smoothing factor (default: 1.0, no smoothing)--run <name>: Specific run name to visualize
Output:
Generates metrics.png with a 3x8 grid (24 subplots). Difficulty groups are color-coded: Easy (green), Medium (orange), Hard (red), Overall (black).
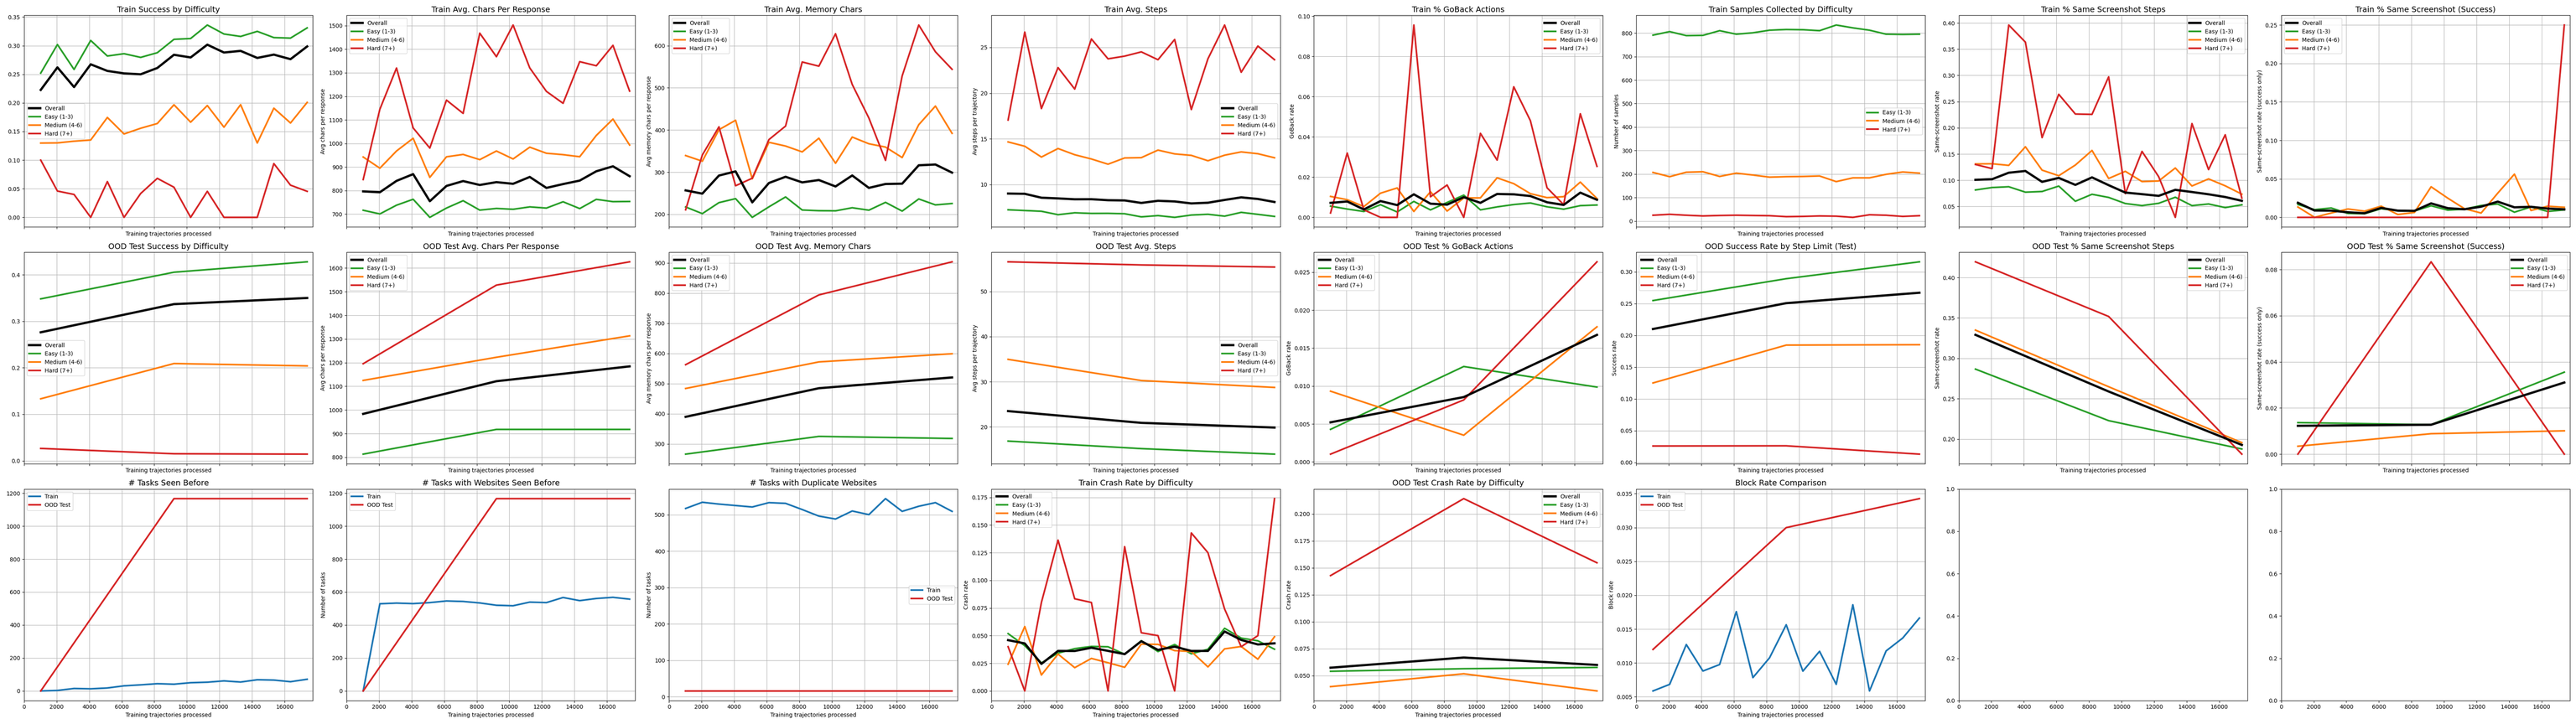
Row 1 - Training: Success rate, avg chars/response, avg memory chars, avg steps, % GoBack actions, samples collected, % same screenshot steps, % same screenshot (success only)
Row 2 - OOD Test: Same metrics as Row 1 but for out-of-distribution test set, plus step-limited success rate
Row 3 - Diversity/Error: Tasks seen before, tasks with websites seen before, duplicate websites, train/test crash rates, block rate comparison
Task Monitor
The task monitor (webgym/environment/task_monitor.py) provides real-time visualization of parallel task execution during rollouts.
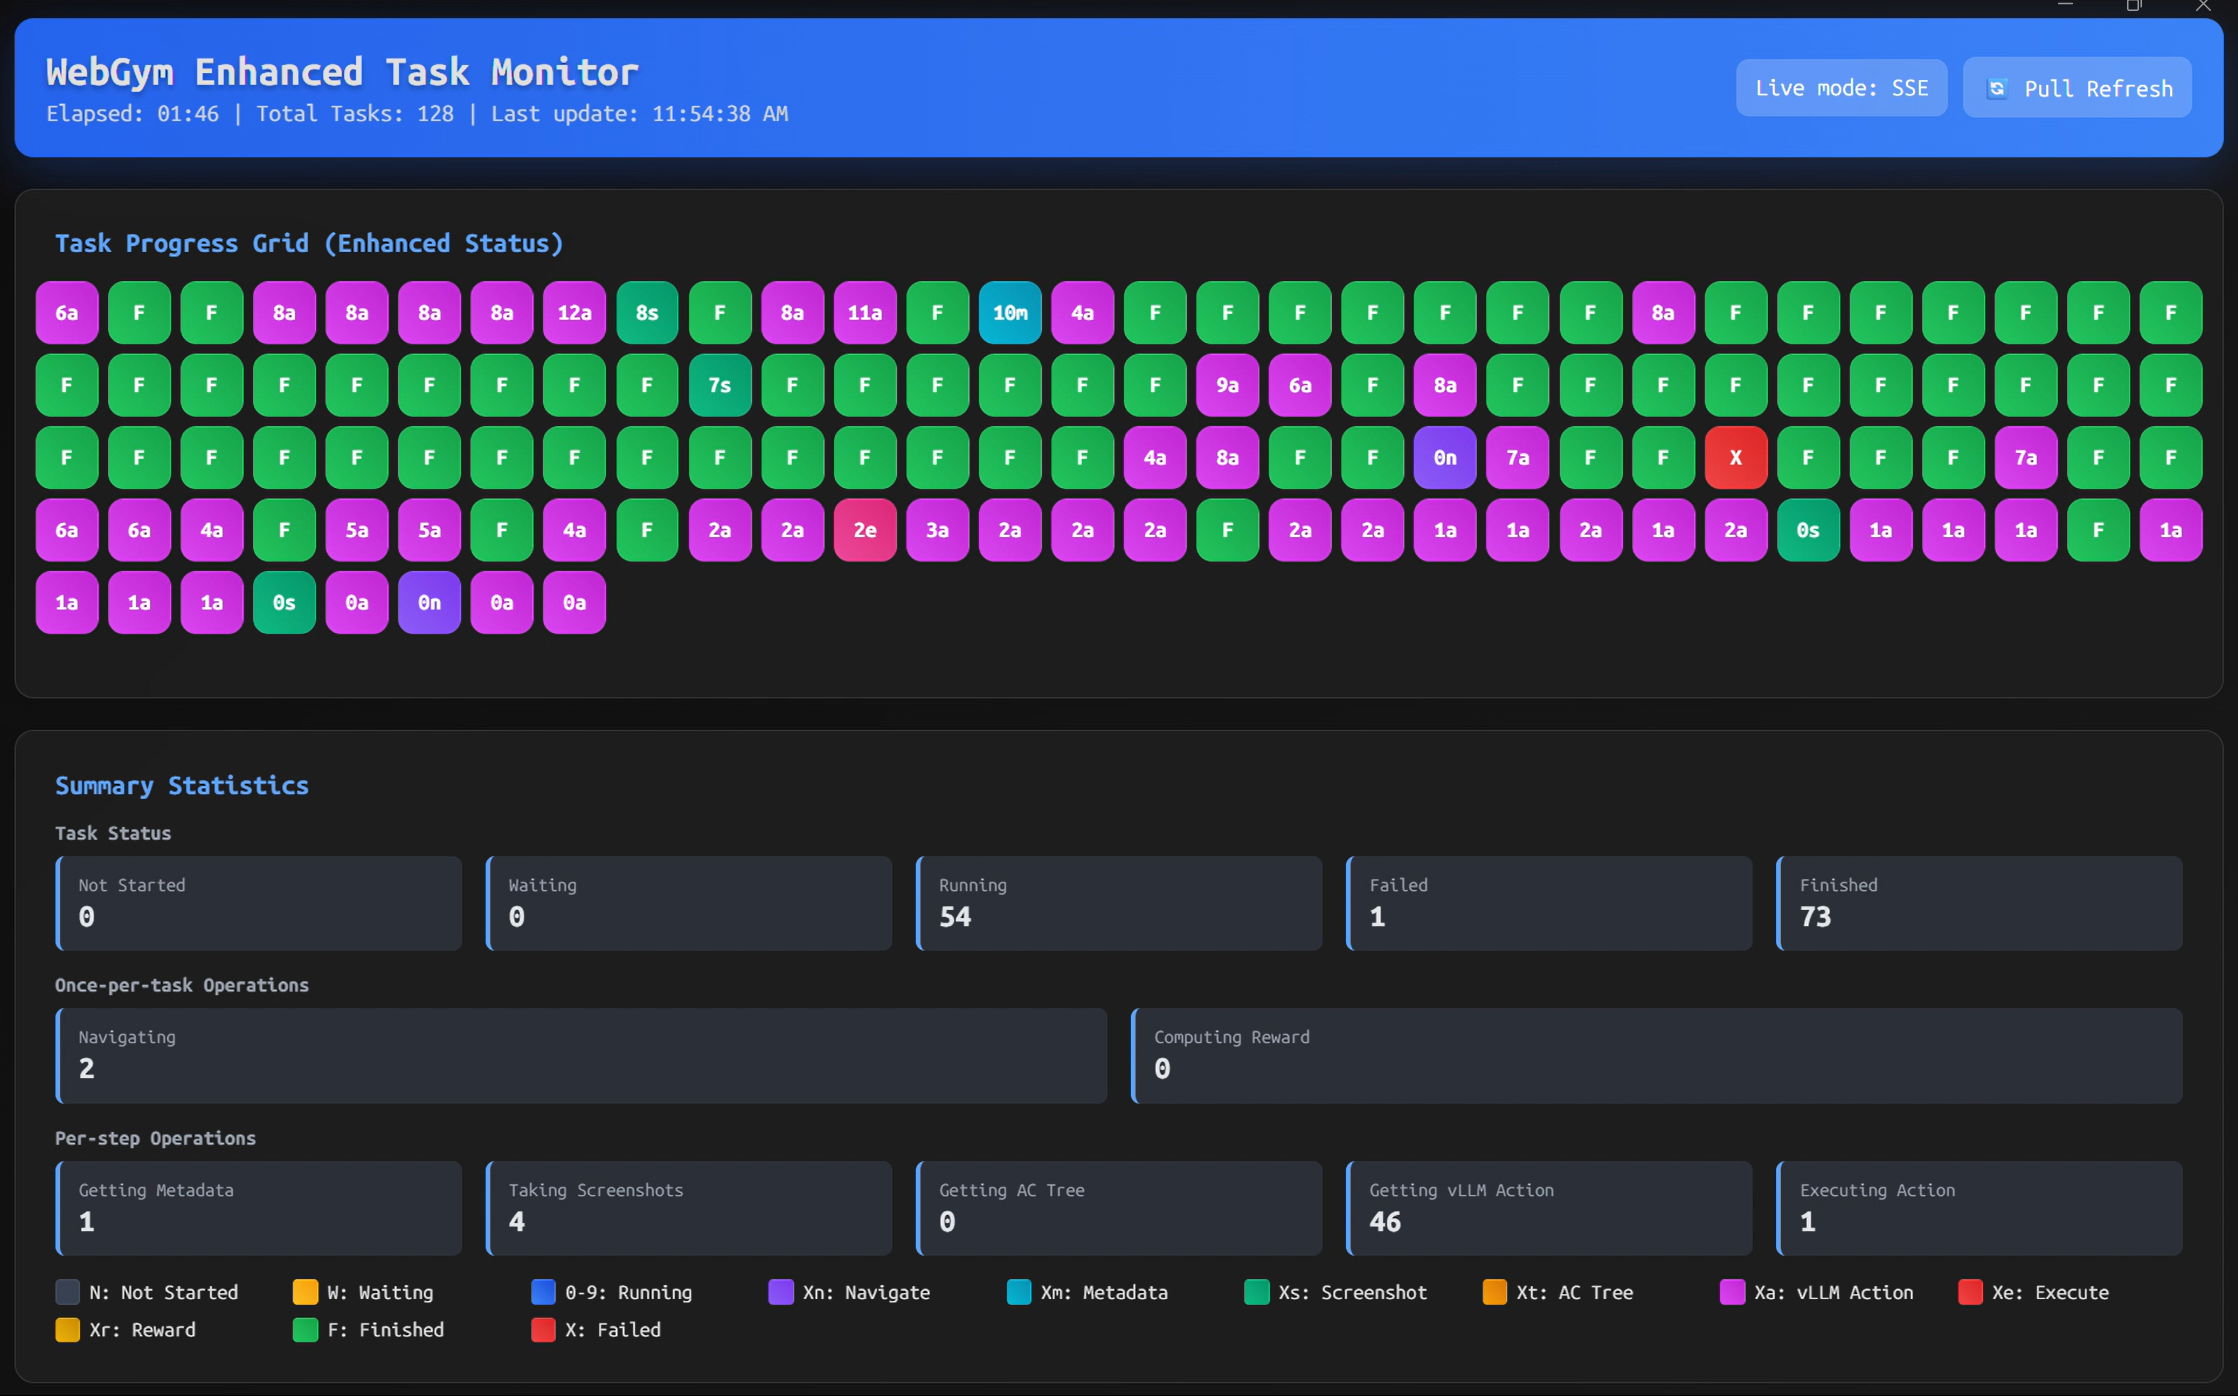
Key Features:
Real-time web dashboard with SSE updates at
http://0.0.0.0:5000Fine-grained operation tracking per task
Color-coded progress grid with automatic downsampling for >512 tasks
Non-blocking lock acquisition to avoid impacting task execution
Usage:
from webgym.environment.task_monitor import TaskMonitor

monitor = TaskMonitor(total_tasks=100, max_steps=10, enable_web_dashboard=True, web_port=5000)
monitor.start_monitoring()

monitor.start_task("task_0001", task_name="Example Task")
monitor.set_task_navigating("task_0001", url="https://example.com")
monitor.update_task_step("task_0001", step=1)
monitor.finish_task("task_0001", success=True)

monitor.stop_monitoring()
Task Status Codes:
N: Not Started,W: Waiting,0-9: Running (step number),F: Finished,X: Failed
Operation Codes (per-step: Xm metadata, Xs screenshot, Xt AC tree, Xa vLLM action, Xe executing; per-task: Xn navigating, Xr reward):
Integration: Automatically initialized by AsyncWebGym with enable_web_dashboard=True and web_port=5000.
API:
# Status updates
monitor.start_allocation_wait(task_id, task_name="")
monitor.start_task(task_id, task_name="")
monitor.update_task_step(task_id, step)
monitor.set_task_navigating(task_id, url="")
monitor.set_task_getting_metadata(task_id)
monitor.set_task_taking_screenshot(task_id, step=None)
monitor.set_task_getting_ac_tree(task_id)
monitor.set_task_getting_action(task_id)
monitor.set_task_executing_action(task_id, action="")
monitor.set_task_computing_reward(task_id)
monitor.set_task_normal_phase(task_id)
monitor.finish_task(task_id, success=True, error_message="")

# Queries
summary = monitor.get_progress_summary()
snapshot = monitor.get_status_snapshot()